|
|
| |

|
|
|
|
|
|
GNP per Capita Teaching
"For Teachers"
Activities (with answers)
Gross national product (GNP) per capita is the dollar value of a country’s final output of goods and services in a year, divided by its population. It reflects the average income of a country’s citizens. Knowing a country’s GNP per capita is a good first step toward understanding its economic strengths and needs.
|
![]()
Exploring the GNP per Capita Text
1. Read the definition of GNP per capita and answer the following questions:
2. Read the definitions of low-income, middle-income and high-income countries and answer the following questions:
3. The items listed below would be included in calculating a country’s GNP. Which items are goods? Which are services?
4. Answer each of the following questions briefly, referring back to the text if necessary.
5. Calculate GNP per capita for countries A and B using this formula: GNP � Population = GNP per capita
| GNP | Population | GNP per capita | |
| Country A | $16,512,000,000 | 103,200,000 | [$160] |
| Country B | $1,560,060,000,000 | 121,500,000 | [$12,840] |
Based on your answers, identify each country as low income, middle income, or high income. [Country A is low income; country B is high income.]
6. Use the population information in the table below to answer the question that follows.
| Percentage of total world population, 1995 |
GNP per capita, 1995 |
|
| Low-income economies | 56% | $430 |
| Middle-income economies | 28% | $2,390 |
| High-income economies | 16% | $24,930 |
How many times greater is the average GNP per capita of high-income countries than that of low-income countries? [$24,930 � $430 = 58 times]
7. Read the definition of growth rates, then calculate the annual GNP per capita growth rates for countries A and B using the following formula:
| Change in GNP per capita in a year |
� | GNP per capita at the start of the year |
x | 100 | = | Annual GNP per capita growth rate (%) |
| GNP per capita at the start of the year |
GNP per capita at the end of the year |
Changes in GNP per capita during the year |
Annual GNP per capita growth rate |
|
| Country A | $113 | $110 | [-$3] | [-2.7%] |
| Country B | $1,590 | $1,700 | [$110] | [6.9%] |
Note: Average annual growth rates of GNP per capita for a period of years provide a better picture than rates for a single year. Calculating any growth rate for a period longer than a year requires more complicated mathematical formulas than the one used to calculate an annual rate.
8. Purchasing power parity (PPP) is used to compare how much a dollar can buy in different countries. If GNP per capita goes up after being adjusted for PPP, one can buy more goods and services than the GNP per capita figure would suggest. If it goes down after adjustment, one can buy less than the figure would suggest. Look at the following table and answer the questions below.
| GNP per capita 1995 |
GNP per capita (PPP) 1995 |
|
| Country A | $17,390 | $23,790 |
| Country B | $31,250 | $27,940 |
9. Natural resource accounting tries to measure and allow for the costs of depleting natural resources and degrading the environment that can be part of economic growth. Listed below are some products that would add value to a country’s GNP. For each product, list some potential environmental and resource costs that might not be recognized in GNP, but which would be included in natural resource accounting.
| Product | Potential environmental and resource costs
|
|
Wood furniture |
[Possible answer: Cutting down trees for wood could result in lack of trees for future use; decrease in the Earth’s ability to purify air; soil erosion which could make land less fertile and increase dangers of flooding; silting; loss of habitat for wildlife; and decrease in biodiversity.] | Food crops | [Possible answer: Growing food crops such as maize could result in soil erosion which can make land less fertile and increase dangers of flooding; silting; water pollution from pesticides and fertilizers; and loss of soil nutrients. Farmers’ use of irrigation could deplete fresh water resources or cause salinization of the soil which happens when fields are over-irrigated.] | Electricity from a coal burning plant | [Possible answer: Mining the coal could result in a lack of coal for future energy use and land degradation of the mining area, which could result in a loss of habitat for wildlife. Burning coal for electricity could result in air pollution; acid rain; pollution of rivers and lakes; destruction of fisheries; decrease in biodiversity; and decreased crop yields.] |
| [ Without answers ] | [Back to text] | [ Top ] | [ Table of Contents ] |
Exploring the Map
1. According to the map key, which color represents low-income economies? [orange] Which color represents middle-income economies? [yellow] Which color represents high-income economies? [green]
2. Find Argentina, Germany, India, South Africa, and United Arab Emirates on the map. What income group does each country belong to? [Argentina and South Africa are middle income; Egypt and India are low income; Germany is high income] Compare the color of each country with those of its neighbors. To what extent is each country typical of conditions in its area and region? [Argentina and India are typical of their regions; Germany and Egypt are somewhat typical of their regions; South Africa is less typical of its region.]
3. Which income group is most represented in Sub-Saharan Africa? [low income] South America? [middle income] North America? [high income]
| [ Without answers ] | [Back to map] | [ Top ] | [ Table of Contents ] |
Exploring Chart 1
1. Study Chart 1 which shows GNP, population, and GNP per capita for low- and middle-income and high-income countries. What does it show you about the differences in the production of goods and services between high-income countries and low- and middle-income countries? [Production of goods and services in low- and middle-income countries is much less than in high-income countries, and population is much larger; therefore, on average, each person gets a much smaller share of total production.]
2. Compare GNP per capita in low- and middle-income and high-income countries.
3. If a country slows down its population growth rate, is its GNP per capita likely to increase or decrease? [Increase, because there are fewer people to share the wealth than there would have been at the original rate of population growth.]
4. Based on the text and your own knowledge, list three possible social and three possible economic reasons for the difference in productivity between high-income and low- and middle-income countries. [Social: population growth rate, health of population, education and work skills of population. Economic: value and variety of exports, access to world markets, wages and prices for goods and services, savings and investment rate, access to raw materials and capital, access to machines and technology, government policies]
| [ Without answers ] | [ Back to Chart 1] | [ Top ] | [ Table of Contents ] |

Exploring Chart 2
1. Read the definition of growth rates then use the data from Chart 2 to complete the following table:
| GNP growth rate |
Population growth rate |
GNP per capita growth rate |
|
| Low-income economies (with China and India) | [5.9%] | [1.9%] | [3.8%] |
| Low-income economies (without China and India) | [1.8 %] | [2.6%] | [-0.9%] |
| Middle-income economies | [1.4%] | [1.7%] | [-0.4%] |
| High-income economies | [2.8%] | [0.7%] | [2.1%] |
2. When calculating data trends by country income groups, the low-income country group data are frequently calculated both with and without China and India. This is because China and India are so large that trends in their individual populations, economies, and environments can overshadow trends throughout the remaining countries in the group.
3. Study the growth rate data from the table you created for question 1. Imagine you are the leader of a country and have pledged to improve the standard of living for your average citizens. Which income group’s GNP growth rate would you try to match? Explain. [The low-income countries with China and India because their GNP growth rate is the highest of any group.] Which income group’s population growth rate would you try to imitate? Explain. [The high-income countries, because their population growth rate is the lowest of any group.] Why would this be a good combination? [Because a high GNP growth rate coupled with a low population growth rate would result in a high GNP per capita growth rate. This would mean that the average person’s standard of living would most likely improve.]
4. Looking back at the text and at the data in the table you created for question 1, argue for or against the following statement:
Raising standards of living in low-income countries depends on one thing only: reducing population growth.
| [ Without answers ] | [ Back to Chart 2] | [ Top ] | [ Table of Contents ] |

Exploring Chart 3
| Share of income | |||
| Richest 20% | Middle 60% | Poorest 20% | |
| Tanzania | 45.4% | 47.7% | 6.9% |
| Morocco | 46.3% | 47.1% | 6.6% |
| United Kingdom | 40.8% | 51.6% | 7.6% |
1. Chart 3 shows the percentage of GNP earned by the richest 20 percent, middle 60 percent, and poorest 20 percent of a low-income, middle-income, and high-income country (actual percentages are given in the table above).
2. Since national income tends to be closely related to quality of life indicators, what patterns would you expect to see in life expectancies, literacy rates, and access to safe water and sanitation among rich and poor people within nations? [The rich probably would have higher rates of life expectancy, literacy, and access to safe water and sanitation than the poor of the same country, unless the government and others instituted policies or programs to improve health, education, and water and sanitation services to those who can least afford them.]
3. Look at Chart 3.1 to see the actual average per capita incomes for the richest, middle, and poorest groups of people in these three countries.
| [ Without answers ] | [ Back to Chart 3] | [ Top ] | [ Table of Contents ] |
Exploring the Data Table
1. Read the definition of purchasing power parity (PPP), then compare the GNP per capita and the PPP columns in the Data Table. In which countries is the GNP per capita higher than the GNP per capita adjusted for PPP? [Hong Kong, Japan, Singapore, Austria, Belgium, Denmark, Finland, France, Germany, the Netherlands, Norway, Sweden, Switzerland, and United Arab Emirates.] In which income group are these countries? [High-income] What does this tell you about the cost of goods and services in these countries? [Goods and services tend to be more costly in these countries than in others. People here may have high per capita incomes, but they are not able to buy as much with each dollar.]
2. Make a copy of the blank Comparative Data Table and label the first column Countries, the second column GNP per capita, 1995, the third Population growth rate, 1980-95, the fourth Access to safe water, 1989-95, and the fifth Access to sanitation, 1989-95. Then, using the text and the Data Table, fill in the chart according to the instructions below.
3. Make a copy of the blank Comparative Data Table and label the first column Countries, the second column GNP per capita, 1995, and the third column GNP per capita, PPP, 1995. Compare GNP per capita and GNP per capita adjusted for PPP in six countries from six different regions of the world by following these steps:
4. Take the Comparative Data Table you prepared for question 2 above, and add a sixth column labeled GNP per capita, PPP, 1995.
| [ Without answers ] | [Back to Data Table ] | [ Top ] | [ Table of Contents ] |
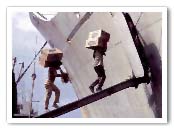
Exploring Photo 1
1. Look at the photograph. Describe what you see.
[Men are loading bananas onto a ship.]2. Would this be a common scene in your country? Why or why not? [ Answers will vary.]
3. In which country was this photograph taken? [Ecuador]
4. Find the country in the world and regional map gallery. What region is it in? [South America]
5. Find the country in the Data Table and determine if it is a low-, middle-, or high-income economy. [It is a middle-income economy.] 6. According to the Data Table, what is this country's projected population growth rate for 1995-2010? [1.7%] Its 1995 GNP per capita? [$1,390] Its 1989-1995 percentage of population with access to safe water? [70%] 7. What do you think life is like for the average person in this country? Support your answer. [Answers will vary, but should take into account the possible effects of the population growth rate, the GNP per capita, and the percentage of the population with access to safe water on the quality of life.] 8. What, if any, aspects of the activity shown in the photograph might help improve living standards in industrial countries? [Possible answer: Industrial countries will have access to goods (bananas) that they may not be able to grow in their own countries.] In developing countries? [Possible answer: People in developing countries can export goods (bananas) to industrial countries in order to import goods and services that might not be available in their countries.] 9. Which sector of development (i.e., social, economic or environmental) is best represented by the photograph? Explain your answer. Is it possible for this photograph to represent other sectors as well? In what way? [Answers will vary.] 10. To what extent does the activity in the photograph demonstrate sustainable development? Explain your answer. [Answers will vary.]| [ Without answers ] | [Back to Photo 1] | [ Top ] | [ Table of Contents ] |
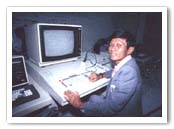
Exploring Photo 2
1. Look at the photograph. Describe what you see.
[A man is working at a computer.]2. Would this be a common scene in your country? Why or why not? [Answers will vary.]
3. In which country was this photograph taken? [Thailand]
4. Find the country in the world and regional map gallery. What region is it in? [Asia (South and East) and the Pacific]
5. Find the country in the Data Table and determine if it is a low-, middle-, or high-income economy. [It is a middle-income economy.] 6. According to the Data Table, what is this country's projected population growth rate for 1995-2010? [0.7%] its 1995 GNP per capita? [$2,740] its 1989-1995 percentage of population with access to safe water? [81%] 7. What do you think life is like for the average person in this country? Support your answer. [Answers will vary, but should take into account the possible effects of the population growth rate, the GNP per capita, and the percentage of the population with access to safe water on the quality of life.] 8. What, if any, aspects of the activity shown in the photograph might help improve living standards in industrial countries? In developing countries? [Possible answer: For both industrial and developing countries, computer technologies can help increase worker productivity and increase GNP per capita, which in turn can improve living standards.] 9. Which sector of development (i.e., social, economic or environmental) is best represented by the photograph? Explain your answer. Is it possible for this photograph to represent other sectors as well? In what way? [Answers will vary.] 10. To what extent does the activity in the photograph demonstrate sustainable development? Explain your answer. [Answers will vary.]| [ Without answers ] | [Back to Photo 2] | [ Top ] | [ Table of Contents ] |
Exploring GNP per Capita Case Study 1
1. Before receiving her loan, how did Mala and her husband support their family? [They worked on their land. They were tied to the growing seasons.]2. What did Mala use her SHARE loan for? [She bought a cow and a goat.]
3. Aside from giving some additional income, how did Mala’s investment add to the financial stability of the family? [It helped to ensure that the family had income throughout the year, not just at planting and harvest times.]
4. Why didn’t Mala use the money she borrowed from SHARE to pay for the roof and her children’s shoes? [By investing in the cow and goat, she could ensure that she would have profits for years to come which she could use to pay back the loan as well as buy things her family needed. If she had used the money to buy shoes and a roof at the beginning, she would have had no means of paying the money back, nor would she have been able to buy other things for her family later on.]
5. Who are the clients served by the SHARE loan program? [The clients of the SHARE program are poor women in developing countries who would otherwise have no access to credit to develop their businesses.]
6. How does microfinance work? [People who cannot get regular loans because they are poor credit risks are able to come together and borrow money as a group. They take joint responsibility for the repayment of their loan. The recipients of the loans invest the money in their businesses--for example by buying new equipment, farm animals, or seed, or by hiring additional employees--in order to make their businesses grow at a faster rate and make greater profits. Studies show that the money made from the investment usually goes toward food, shelter, clothing, or education for the family, thus increasing the chance that the generations that follow will be healthier and more financially secure than their parents.]
7. How can microfinance, which works on a small, individual level, affect the larger economy? [By lending money to poor people to start their own businesses, microfinancing helps to improve individual standards of living. Beyond that, recipients of microfinance loans contribute to the national economy by producing more goods and services and often hiring others to work for them. And with the additional money they earn, they can buy more goods and services, again adding to the national economy. In addition, microfinancing can help more people move from the informal economy to the formal.]
8. This case study shows how microfinancing works in developing economies. Would industrial economies be able to benefit from a similar system? Explain your answer. [Answers will vary.]
9. How do people get small business loans where you live? How well does the system work? Explain your answer. [Answers will vary.]
| [ Without answers ] | [Back to Case Study 1] | [ Top ] | [ Table of Contents ] |
GNP per Capita Research & Explore
1. Listed below are some activities that would help increase a country's GNP per capita growth. Assume that you are an officer in the Ministry of Planning. Because funds are limited, not all plans can be implemented at once.
2. How does your local government spend its money? Use your local newspaper, government offices, council members, and other sources to find out what community infrastructure projects (for example, roads, railways, buildings, telecommunications systems, energy supply systems, or water and sanitation systems) have been approved by your local government within the last year. Choose one project that is interesting to you, and answer the following questions:
3. How has technology affected the workplace? Interview someone in your family or community who has performed the same work or has worked at the same company for more than twenty years to find out how technology has or has not altered their work productivity and environment and job security.
| [ Back to Research & Explore ] | [ Top ] | [ Table of Contents ] |
| Copyright � 1998 IBRD/The World Bank |
[email protected] |