|
|
| |
|
|
|
|
|
|

|
Exploring Chart 1 |
Test Yourself |
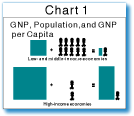
1. Study Chart 1 which shows GNP, population, and GNP per capita for low- and middle-income and high-income countries. What does it show you about the differences in the production of goods and services between high-income countries and low- and middle-income countries?
2. Compare GNP per capita in low- and middle-income and high-income countries.
3. If a country slows down its population growth rate, is its GNP per capita likely to increase or decrease?
4. Based on the text and your own knowledge, list three possible social and three possible economic reasons for the difference in productivity between high-income and low- and middle-income countries.
| Copyright � 1998 IBRD/The World Bank |
[email protected] |