
Chart 1. GNP, Population, and GNP per Capita, 1995
Exploring Chart 1
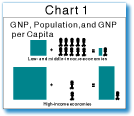
1. Study Chart 1 which shows GNP, population, and GNP per capita for low- and middle-income and high-income
countries. What does it show you about the differences in the production of goods and services between high-income
countries and low- and middle-income countries?
|
Enter your answer in the space
below: |
Suggested answer: |
|
|
|
2. Compare GNP per capita in low- and middle-income and high-income countries.
- Refer to the Data Table and choose four countries--your own, one low-income, one middle-income, and one
high-income.
|
Enter your answer in the space
below: |
Suggested answer: |
|
|
|
- Refer to column 5 in the Data Table and find the GNP per capita in 1995 for each country you selected.
|
Enter your answer in the space
below: |
Suggested answer: |
|
|
|
- How many times larger is GNP per capita in the high-income country than in the low-income and middle-income countries? (Divide GNP per capita in the high-income country by GNP per capita in each of the developing countries.)
|
Enter your answer in the space
below: |
Suggested answer: |
|
|
|
- How many times larger or smaller is the GNP per capita in your country than that in the middle-income country?
|
Enter your answer in the space
below: |
Suggested answer: |
|
|
|
3. If a country slows down its population growth rate, is its GNP per capita likely to increase or decrease?
|
Enter your answer in the space
below: |
Suggested answer: |
|
|
|
4. Based on the text and your own knowledge, list three possible social and three
possible economic reasons for the difference in productivity between high-income and low- and middle-income countries.
|
Enter your answer in the space
below: |
Suggested answer: |
|
|
|
Answers
Home | Site Guide | Modules | What's SD? | SD Post | Resources | About DEP | Feedback
