Closing the Achievement Gap in America's Public Schools |
 |
| |
 | |
 | | 
Text (Slide 11):
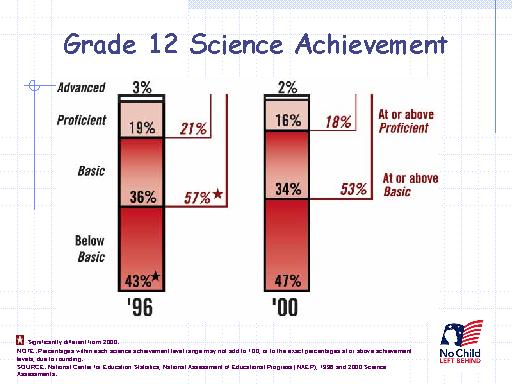
Grade 12 Science Achievement
In 1996 21% were at or above Proficient and 57%* were at or above Basic.
- 3% Advanced
- 19% Proficient
- 36% Basic
- 43%* Below Basic
In 2000 18% were at or above Proficient and 53% were at or above Basic.
- 2% Advanced
- 18% Proficient
- 34% Basic
- 47% Below Basic
* Significantly different from 2000.
NOTE: Percentages within each science achievement level range may not add to 100,
or to the exact percentages at or above achievement levels, due to rounding.
SOURCE: National Center for Education Statistics, National Assessment of Educational
Progress (NAEP), 1996 and 2000 Science Assessments.
|