Closing the Achievement Gap in America's Public Schools |
 |
| |
 | |
 | | 
Text (slide 9):
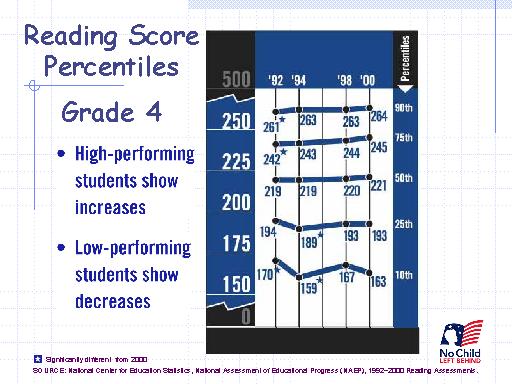
Reading Score Percentiles
Grade 4
High performing students show increases. Low performing students show decreases.
(Highest possible score is 500.)
| Percentile |
1992 |
1994 |
1998 |
2000 |
| 90th |
261* |
263 |
263 |
264 |
| 75th |
242* |
243 |
244 |
245 |
| 50th |
219 |
219 |
220 |
221 |
| 25th |
194 |
189* |
193 |
193 |
| 10th |
170* |
159* |
167 |
163 |
* Significantly different from 2000.
SOURCE: National Center for Education Statistics, National Assessment of Educational
Progress (NAEP), 1992–2000 Reading Assessments.
|