
Table of Contents
"For Teachers"
Access to Safe Water
Teaching
Activities
Access to safe water is measured by the number of people who have a reasonable means of getting an adequate amount
of water that is safe for drinking, washing, and essential household activities, expressed as a percentage of the total
population. It reflects the health of a country’s people and the country’s capacity to collect, clean, and distribute water to
consumers.
- More than one billion people lack access to safe water. Close to two billion people lack access to sanitation. Most of
these people live in low- and middle-income countries.
- Each year, nearly a billion people suffer from diarrheal illnesses caused by unsafe water. Millions more suffer from other
water-related diseases. Poor people, especially the very young and the elderly, tend to be the most at risk.
- Safe water is scarce because it is often undervalued and used inefficiently.
- As a country’s economy becomes stronger—as its GNP per capita rises—a larger percentage of its people tend to have
access to safe water and sanitation.
- Thoughtful decisionmaking by all user groups generally leads to improvements in the supply of safe water for all people at
affordable prices.
|

Exploring the Access to Safe Water Text
1. Read the text and the definition of access to safe water and answer the
following questions:
- What does this indicator measure?
- How is "reasonable" access defined for people in urban areas?
- How is "reasonable" access defined for people in rural areas?
- What would you consider a reasonable amount of time to spend each day getting water?
- How do you and your family get water?
2. When people drink contaminated water, they can become ill. Answer each of the following questions briefly, referring
back to the text if necessary.
- How many people suffer each year from diarrheal diseases related to dirty water?
- Which people or age group(s) are at greatest risk? Why might this be the case?
- If so many people become ill from contaminated water, why do they drink it?
3. Using the text and your own experience, complete the following exercises.
- Make a list of some of the ways in which you and your community use water. To the right of each item, write an "H" for household uses or a "C" for community use. Place an asterisk (*) next to the items that probably
require safe water.
- Which of these uses are likely to pollute water?
4. Listed below are some household uses of water and estimates of how much water they use (based on an industrial
country plumbing system). From these estimates, answer the questions that follow.
|
Flushing toilets |
3–5 gallons of water per flush |
|
Brushing teeth, washing dishes, etc. |
3–5 gallons of water per minute for running tap |
|
Showering |
5–7 gallons of water per minute |
|
Bathing |
35–50 gallons of water per bath |
- Assuming that each member of your family had access to 20 liters (approximately 5 gallons) of safe water each day (the
amount most often cited as being "adequate" when defining access to safe water), make a list of how you would
use the water.
- How would you conserve the water?
- How could you re-use some of the water for other purposes?
5. In Bangladesh, the poorest people spend 11 percent of their household income on fuel to boil their drinking water. In
the urban slums of Nigeria, people spend 18 percent of the household income for water. In Port of Spain, the capital of Trinidad
and Tobago, the poorest people spend 20 percent of their household income for water.
- Find these three countries on the map. What regions do they belong to?
- How much would a family earning $40,000 a year spend for water in each of these countries? (Convert each percentage
to a decimal by dividing it by 100, and then multiply each decimal by $40,000.)
6. Answer each of the following questions briefly, referring back to the text if necessary.
- What are three major contaminants that contribute to the scarcity of safe water?
- How can contamination from human waste be minimized?
- How might contamination from agricultural and industrial waste be minimized?
7. What does it mean to say that safe water is an "economic" good?
8. Why is it important for all of the consumers of water to be part of the decisionmaking processes concerning safe
water and sanitation?
9. Use the text, charts, and
Data Table to argue for or against this statement:
The poorest people suffer the most from the lack of safe water.
10. Are there times when people in your community do not have enough water? When? Why? What do people do?
Are there any government or community policies to help during these times? If so, what are they?
Access to Safe Water, 1989-95
Exploring the Map
1. Study the map and answer the following questions:
- According to the map key, which color represents the countries with the lowest percentage of
people with
access to safe water? Which color represents the highest?
- Which region of the world has the lowest percentage of people with access to safe water? The next lowest?
2. Find Brazil, China, Morocco, and Nigeria on the map. Compare the color of each country
with those of its
neighbors. To what extent is each country typical of conditions in its area and region? Make a general statement comparing the
six regions.
3. What might social and economic conditions be like in the areas with the lowest percentage of access to safe water?
Chart 1. Percentage of the World’s Population With and
Without Access to Safe Water, 1989–95
Exploring Chart 1
1. Study Chart 1, which shows world population and access to safe water and answer
the following questions.
- What percentage of the world’s population in 1989–95 did not have access to safe water?
- The total population of the world in 1995 was approximately 5.7 billion. Using your answer to question 1a, calculate how many
people were without safe water in the years 1989–95? (Divide the percentage by 100 to get a decimal, then multiply the total
population of the world by the decimal figure).
- How many people did have access to safe water?
2. In the year 2010, the population of the world is projected to reach 6.8 billion.
- If the number of people with access to safe water stays the same as it was in 1989–95, what percentage of the world’s
population in 2010 will have access to safe water? (Divide 4.33 billion by 6.8 billion and multiply by 100.)
- How does this percentage compare with that shown in Chart 1? Based on this information, would the
population in 2010 be better off, worse off, or the same? Explain.
3. Statistics can be powerful tools that help us understand our world. But statistics must be used carefully, and people must
understand what the data do and do not tell us.
It is the year 2000. You are running for reelection after two five-year terms as mayor of a city of 800,000 people. In 1990, the
population was 600,000, and at that time 37 percent of the population in the city had access to safe water. In the year 2000, 40
percent of the population in the city now have access to safe water.
- Did the percentage of population with access to safe water and sanitation increase or decrease during your time as mayor?
By how much?
- Calculate the number of people with access to safe water in 1990. Calculate the
number of people with access to safe water in 2000. Did the number of people with access
to safe water increase or decrease during your time as mayor. By how much?
- Did the number of people without access increase or decrease? (Find the percentage of the population without
access by subtracting the percentage of the population with access from 100%, convert the percentage into a decimal,
and then follow the calculations you used in question 2b.) By how much?
- As mayor, what can you say to voters about the progress you have made in the area of safe water and sanitation?
- What might your challenger say to voters about the lack of progress you have made?
- What can happen if statistics are not used carefully?
- What kinds of problems might make it difficult to provide safe water to people in urban areas where populations are growing
rapidly?
Chart 2. Life Expectancy and Improvements in Water
Supply and Sanitation in Three French Cities, 1820-1900
Exploring Chart 2
1. Read the definition of life expectancy. From your own experience, list at least five factors that can
affect life expectancy.
2. Study Chart 2 which suggests a relationship between life expectancy and improvements in
water supply and
sanitation in three French cities from 1820–1900.
- What was the life expectancy in each city in 1820?
What was the life expectancy in each city in 1900? What
was the general trend for all three cities?
- About what year did each city begin its water supply and sanitation improvements?
- What does the chart suggest was the reason life expectancy was higher in Lyons in 1900 than in Paris or Marseilles?
- According to Chart 2, life expectancy in Marseilles began improving even before water and sanitation did. What are some
possible explanations for this?
3. In the social sciences, researchers usually use current data to explore conditions and issues. Why would water supply,
sanitation, and life expectancy information from 19th century France be helpful for people learning about these issues today?
4. Use the text, Chart 2, and your own knowledge, to argue for or
against this statement:
Access to safe water and sanitation are not luxuries that can wait for a stronger economy; rather, they are necessary
in order to build a stronger economy.
5. You are a government official in a middle-income country. A crisis exists in your country because an epidemic of cholera
has broken out and is spreading rapidly. You are holding an emergency meeting with other officials to decide what to do. As you
plan your course of action, consider the following:
- Cholera is spread by fecal contamination of food and water.
- Victims become extremely thirsty and need lots of water or they will die from dehydration.
- Hospitals are overcrowded in your country even when there is no epidemic.
- Households can boil their drinking water for 10 minutes to make it safe. But most people are not aware of this, and,
even if they were, it would cost the average poor family a third of its income to do so.
- Tourism has disappeared, and other countries will no longer buy fruits and vegetables grown in your country.
- What actions would you take immediately?
- What policies would you set up for the long run?
- How would you pay for these measures?
- What world resources might be available to help your country through this disaster?
 <
<
Chart 3. Sources of Water in Maputo, Mozambique, 1996
Exploring Chart 3
1. Which of the sources of water shown in Chart 3 bring water directly to a person’s
home or yard?
What percentage of the people get their water from these sources?
Which sources of water require people to leave their homes or yards to get water?
What total percentage of the people
get their water from these sources?
2. Think about the sources of water listed above.
- What might be some drawbacks to having to leave your home or yard to get water for your everyday needs?
- Bearing these difficulties in mind, who would you expect to use more water, people with sources of water in their home or
yard, or people who have to fetch it from some place else? Explain.
3. The table below shows the average consumption and cost of safe water for the people of Maputo. Use the information from
the table to answer the questions below.
|
Drinking water
Source
|
Average consumption
Of drinking water
(cubic meters per month)
|
Average cost
of drinking water
(Mts.* per cubic meter)
|
|
House connection |
17.6 |
1,341 |
|
Other sources |
4 |
3,751 |
*Mts. is the abbreviation for Mozambique’s currency, the metical.
- Who uses more drinking water, people with house connections or others? How
many times more water do they use than others?
- Who pays less per unit for their water, people with house connections or others?
- Based on your answers to questions 3a and 3b, make a general statement describing the relationships among water cost,
convenience, and consumption.
- If people without house connections are consuming water at a rate below the World Health Organization's recommended
daily minimum of 20 liters per person, what changes might you expect to see if they were connected to the piped water system?
- How do people in your community get their water?

Exploring the Data Table
1. Make a copy of the blank Comparative Data Table and label the first column Countries, the second
column Access to safe water, 1989–95, the third Population growth rate, 1980–95, and the fourth GNP per
capita, 1995. Then use the text and the Data Table
to fill in the chart according to the instructions below.
- Choose a low-income country in Sub-Saharan Africa and one in Asia (South and East) and the Pacific, and write their
names in the first column.
- Choose a middle-income country in Europe and Central Asia, one in Middle East and North Africa, and one in South America,
and add them to the first column.
- Choose a high-income country in North and Central America and the Caribbean, one in Europe and Central Asia, and one in
Asia (South and East) and the Pacific, and add them to the first column.
- Label each country in your data table with an L, M, or H to show which income group it belongs to: low, middle, or high.
- Read the definitions of access to safe water, population growth rate, and GNP per capita.
Go to the Data Table, and for each of your countries, find the percentage of population with access to
safe water (1989–95), average annual population growth rate (1980–95), and GNP per capita (1995), and write this information
in the appropriate columns of your data table. If data for one of the indicators are not available, select another country
from the same income group and region.
- Rank the countries, with "1" equaling the highest access to safe water and "8" the lowest.
Write the appropriate ranking number in parentheses after the data in column 2.
- Study your chart and answer the following questions:
- In the countries with less than 50 percent access to safe water, are the other indicators high or low?
- In the countries with 50 to 69 percent access to safe water, are the other indicators higher or lower than
in the below 50 percent access countries?
- In the countries with 70 or more percent access to safe water, are the other indicators higher or lower than
in the other countries?
- Does access to safe water follow the same trends as the other development indicators in your chart?
2. Make a copy of the blank Comparative Data Table and label the first column Countries, the second
column Access to safe water, 1989–95, and the third column Access to sanitation, 1989–95. Compare access
to safe water and access to sanitation in six countries from six different regions of the world by following these steps:
- In the column at the left of the table, write the following countries and their regions: Brazil (South America); Ghana (Sub-Saharan
Africa); Philippines (Asia, South and East, and the Pacific); Jordan (Middle East and North Africa); Canada (North and
Central America and the Caribbean); Ukraine (Europe and Central Asia).
- Use the Data Table to find the percentage of the population with access to safe water for each
country and fill in
column 2 in your table.
- Use the Data Table to find the percentage of the population with access to sanitation for each
country and fill in
column 3 in your table.
- Compare the access to safe water and access to sanitation data for each country. Within each country, which indicator is
higher, access to safe water or to sanitation? Are there any countries that have a large difference between the two?
What are some possible reasons for this?
3. Take the Comparative Data Table you prepared for question 2 above, and add a fifth column labeled Access to
sanitation, 1989–95.
- Use the Data Table to find the percentage of population with access to sanitation for each of your
countries and
fill in column 5 in your table. Within each country, which indicator is higher, access to safe water or to sanitation?
Compare your results with those in question 2d. Do your countries follow similar trends? If not, what could be
some possible reasons for the differences?
- Judging from your data, which indicator tends to be more linked to country income group, access to safe water or access to
sanitation?
- Make a general statement about access to safe water and sanitation and development.
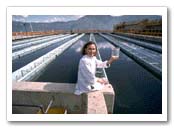
Water Treatment Plant, Colombia
Exploring Photo 1
1. Look at the photograph. Describe what you see.
2. Would this be a common scene in your country? Why or why not?
3. In which country was this photograph taken?
4. Find the country in the world and regional map gallery. What region is it in?
5. Find the country in the Data Table and determine if it is a low-,
middle-, or high-income economy.
6. According to the Data Table, what is this country's projected population growth rate for 1995-2010? Its 1995 GNP per capita?
The percentage of its 1989-95 population with access to safe water?
7. What do you think life is like for the average person in this country? Support your answer.
8. What, if any, aspects of the activity shown in the photograph might help improve living standards in industrial countries? In developing countries?
9. Which sector of development (i.e., social, economic or environmental) is best represented by the photograph? Explain your answer. Is it possible for this photograph to represent other sectors as well? In what way?
10. In what ways might the activity in the photograph encourage sustainable development? In what ways might it discourage sustainable development? Explain
your answer.
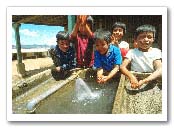
Children Washing Hands, Guatemala
Exploring Photo 2
1. Look at the photograph. Describe what you see.
2. Would this be a common scene in your country? Why or why not?
3. In which country was this photograph taken?
4. Find the country in the world and regional map gallery. What region is it in?
5. Find the country in the Data Table and determine if it is a low-,
middle-, or high-income economy.
6. According to the Data Table, what is this country's projected population growth rate for 1995-2010? Its 1995 GNP per capita? The percentage of its 1989-95 population with access to safe water?
7. What do you think life is like for the average person in this country? Support your answer.
8. What, if any, aspects of the activity shown in the photograph might
help improve living standards in industrial countries? In developing
countries?
9. Which sector of development (i.e., social, economic or environmental) is best represented by the photograph? Explain your answer. Is
it possible for this photograph to represent other sectors as well? In what way?
10. In what ways might the activity in the photograph encourage sustainable development? In what ways might it discourage sustainable development? Explain
your answer.

Exploring Access to Safe Water Case Study 1
1. What are some of the health problems shared by Miguel’s village and the one he is visiting? Which of these problems might be related to the lack of safe water?
2. How is it that people die of diarrhea?
3. In Miguel’s village, how did the sources of water become contaminated? How did this contamination affect Miguel’s family?
4. How do higher well walls and covers help to protect the water?
5. What training did the villagers receive as part of their water project?
6. Why didn’t the people from the water project dig the wells and install the handpumps themselves?
7. Find Bolivia in the Data Table. What is the 1989–95 percentage of the population with access to safe water? What is the 1980–95 population growth rate? What is the 1995 GNP per capita? If more projects like the one in Miguel’s village were to increase the percentage of people with access to safe water, what changes might you expect to see in these and other indicators? Explain you answer.
8. Go to the Data Table and find out how the 1989-95 percentage of the population with access to safe water in Bolivia compares with that of your country. Would a project like the one outlined in the case study work in your community? Explain your answer.
9. Are you aware of any community-run utilities (water, electric, or gas providers) where you live? What might be some advantages of such programs? What might be some disadvantages?
10. How does your community help ensure that the water you drink is safe?
11. What kind of water supply problems, if any, might your community face?
 Access to Safe Water Research and Explore
1. You are the prime minister of a low-income country with a population of 22 million. Sixty percent of the population lives in rural areas; most of the rest live in the capital city. Experts say that in 10 years more than half the population will live in the cities.
Your country faces many problems. One of the most serious is that 17 million people lack adequate sanitation and 15 million of these also lack access to safe water. As a result, thousands of people, mostly children, die each year. Listed below are some activities that may help improve access to safe water and sanitation in your country. Because funds are limited, not all plans can be implemented at once.
- Choose the five activities that you would undertake first and rank them in the order in which you would implement them. Explain why you chose this ranking.
- Set up a team of experts to monitor the quality of the drinking water in wells, lakes, and rivers in rural areas throughout the country.
- Establish a Water Supply Board that will charge households, farmers, and industries the full cost of the water they use and will collect these fees.
- Expand the system of water pipes in urban areas so that even the poorest people have a faucet within 500 feet of their homes.
- Set up a team of experts to monitor the quality of the drinking water in urban areas throughout the country.
- Give tax breaks to those who dig their own wells to supply their own water.
- Run a media campaign using billboards, posters, radio, television, and newspapers to teach people the importance of hand washing and hygiene, how to make their drinking water safer, and how best to care for people, especially children, if they get sick from unsafe water.
- Give the poorest people special vouchers that can be used as money to buy safe water or fuel for boiling the water they have.
- Repair existing water and sewer pipes in urban areas so that clean water is not wasted and dirty water can be safely carried away.
- Make laws that force factories to stop dumping their untreated waste water into rivers and lakes, and establish a team of inspectors to enforce the laws.
- Build two large additional sewerage treatment plants for the capital city.
- Create five mobile health teams that will travel around the country teaching people about the importance of hand washing and better hygiene, how to make their drinking water safer, and how to care for people, especially children, who get sick from dirty water.
- Are there any activities listed that you would not use? Explain.
- What are three additional activities that you would add to your list? Describe each one and explain how would you fit them into your ranking.
2. How does your family use water and how much do they use?
- Make a table with 3 columns. In the first column, list all of the ways water is consumed by your family over the course of a week. In the second column, write how frequently each activity is performed (for example, drinking: 210 glasses/week; laundry: 5 loads/week.) In the third column, figure out the approximate amount of water consumed by this activity each week. If you do not know how much water is used for a given activity, you can use the following list* to make estimates. For activities that are not listed, for example washing a car with a hose, you can approximate consumption by timing how long it takes to wash the car, and multiply that by the amount of water flows through the hose per minute.
| Toilet flush | 6-11 litres |
| Bath | 120 litres |
| Shower | 14 litres/minute |
| Washing machine | 150 litres/load |
| Dishwashing (auto) | 30 litres/load |
| Dishwashing (by hand) | 10 litres |
| Sprinkler | 10 litres/minute |
| Running garden hose | 20 litres/minute |
| Running tap water | 6-10 litres/minute |
| Filling swimming pool | 50,000 litres/pool |
- How much water is wasted by water system leaks in your home? Check for leaking faucets, running toilets, and leaking water tanks. A slow drip from a water tap can waste up to 11,000 litres/month; even more for a steadily running toilet.
- Make a list of at least ten ways you can help to conserve water in your household, then choose three of the most promising and try to do them for one month in your home. At the end of the month figure out how much water you have saved.
- If your family receives a monthly phone bill, compare the water bill from the month before you started your conservation efforts with the next month’s bill. How much money did you save your family?
* This list is based on information from the Yarra Valley Water website developed by Yarra Valley Water, Victoria, Australia. For additional water system activities, see their web site at www.yvw.com.au/schools/index.htm.
3. In order to make responsible decisions about community water supplies, it is important to have a full understanding of where water comes from and how water quality is maintained. Research your own water supply by answering the following questions. Use a variety of sources which may include your family, government offices, library, newspapers, internet, and local utility companies as primary sources.
- Where does your water come from, and how does it get to your home?
- Does everyone in your community get their water from the same source? If not, what are the other sources, and how many people use them?
- Are some of these sources more expensive than others?
- How is water from all of the sources tested for quality, and how frequently? Are some of the sources safer than others?
- What are the greatest threats to water quality where you live?
- How reliable is your water supply? Research the average rainfall for your area. When are the driest months? Are there times when safe water is in short supply? If yes, what does your community do at these times?
- What can you do to help ensure sustainable water use in your community?
Home | Site Guide | Modules | What's SD? | SD Post | Resources | About DEP | Feedback
