|
|
| |
|
|
|
|
|
|
"For Teachers"
Teaching Activities
Population growth rate (PGR) is the increase in a country’s population during a period of time, usually one year, expressed as a percentage of the population at the start of that period. It reflects the number of births and deaths during a period and the number of people migrating to and from a country.
|
Exploring the PGR Text
1. Read and study the text and the definition of population growth rate and answer the following questions.
2. Answer each of the following questions briefly, referring back to the text if necessary.
3. Calculate the annual population growth rate for countries A, B, and C using data provided in the table below and this formula:*
|
Population increase |
|
Population at |
|
|
|
Annual population |
|
|
Population |
Population |
Population |
Annual |
|
Country A |
22,000,000 |
22,400,000 |
||
|
Country B |
8,500,000 |
8,800,000 |
||
|
Country C |
400,000,000 |
410,000,000 |
*
(Average annual population growth rates for a period of years provide a better picture than annual rates. For this reason, they are used in the Data Table. Calculating any growth rate for a period longer than a year requires more complicated mathematical formulas than the one used to calculate an annual rate.)4. Population growth rates are small numbers, but they have large effects on population. To see what this means, do the following:
5. Use the calculations and data in the table below to calculate the birth rates, death rates, and population growth rates for three countries and fill in the missing information.
|
Number of births |
� |
Population |
X |
100 |
= |
Birth rate |
|
|
|
|
|
|
|
|
|
Number of deaths (%) |
� |
Population |
X |
100 |
= |
Death rate |
|
|
|
|
|
|
|
|
|
|
Birth rate |
– |
Death rate |
= |
Population |
|
|
Births |
Deaths |
Population |
Birth |
Death |
Population |
|
|
|
|
|
|
|
|
|
|
Country A |
662,000 |
297,000 |
33,100,000 |
|||
|
Country B |
411,000 |
191,800 |
27,400,000 |
|||
|
Country C |
211,200 |
96,800 |
4,400,000 |
6. If a population growth rate is low, population is growing slowly. If it is high, population is growing rapidly. To understand what "slow" and "rapid" mean, it helps to look at how long it will take different countries growing at different rates to double their population.
7. What consequences might a declining population growth rate have on a country’s economy and environment?
| [Back to Text] | [ Top ] | [ Table of Contents ] |

Exploring the Map
1. According to the map key, what color represents countries with lower population growth rates? Where do these countries tend to be located?
2. What color represents countries with higher population growth rates? Where do these countries tend to be located?
3. Which continent has the largest number of countries with a high PGR? What assumptions might you make about living conditions there?
4. Name and locate on the map three countries with population growth rates of more than 3 percent, three with rates of 2 to 3 percent and three with rates of less than 1 percent. To what extent are these countries typical of other countries in their regions?
| [Back to Map] | [ Top ] | [ Table of Contents ] |

Exploring PGR Chart 1
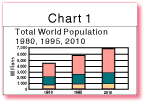
1. Study Chart 1 which shows the world population size by country income group for 1980, 1995, and 2010. What is the total world population for each year? How much will total world population have increased from 1995 to 2010?
2. Use the data in the table below to complete the following exercises.
|
|
1995 |
2010 |
|
|
(millions) |
(millions) |
|
Low-income economies |
3180 |
3971 |
|
Middle-income economies |
1591 |
1916 |
|
High-income economies |
902 |
963 |
|
|
|
|
|
Total world population |
5673 |
6850 |
3. Use the Data Table to identify the five most populous countries in 1995 along with their populations, their regions, and their income groups, and fill in the following table:
Country |
1995 population |
Region |
Income group |
|
|
|
|
|
|
|
|
|
|
|
|
|
|
|
|
|
|
|
|
|
|
|
|
|
4. Use the Data Table to fill in the population information for China and India in the following table. Next, calculate the percentage of the world’s population that is represented by China and India for 1995 and 2010 and add that information to the table. (Divide each country’s population by the world’s population and multiply the figure by 100.) Then answer the questions that follow.
|
Population |
% of world |
Average |
Population |
% of world |
|
|
China |
.8 |
||||
|
India |
1.3 |
||||
|
World |
5,673,000,000 |
---- |
1.3 |
6,850,000,000 |
--- |
5. In 1995, four out of every five people in the world lived in low- and middle-income countries. As this percentage increases, what might be some of the impacts on the global economy? On the environment? On peace and security issues?
| [Back to Chart 1] | [ Top ] | [ Table of Contents ] |

Exploring PGR Chart 2
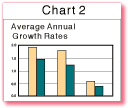
1. Study the information in Chart 2. What is happening to the average annual population growth rate in low- and middle-income countries over time?
2. According to Chart 1, what is happening to the population size in low- and middle- income countries over time?
3. How do you explain these two trends?
4. The table below shows population data for three developing countries. Complete the table by calculating the annual population increase for each country (divide the percentage by 100 to get a decimal, then multiply population size by the decimal figure), then answer the questions that follow.
|
Country |
Population |
Average |
Annual |
|
Ethiopia |
|
|
|
|
1980 |
38,000,000 |
2.7 |
|
|
1995 |
56,000,000 |
2.8 |
|
|
|
|
|
|
|
Pakistan |
|
|
|
|
1980 |
83,000,000 |
3.0 |
|
|
1995 |
130,000,000 |
2.5 |
|
|
|
|
|
|
|
Ukraine |
|
|
|
|
1980 |
50,000,000 |
.2 |
|
|
1995 |
52,000,000 |
–.2 |
5. What effect might a declining population growth rate have on a country’s economy and environment?
6. Why might a country not want to slow its population growth?
| [Back to Chart 2] | [ Top ] | [ Table of Contents ] |

Exploring PGR Chart 3
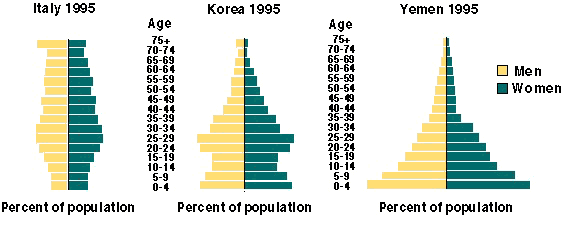
1. Study the information in Chart 3.1 for low- and high-income economies in 1995. Then, answer the following questions about the population trends shown.
2. Study the information in Chart 3.2 for low- and high-income economies in 2025. Then, answer the following questions about the population trends shown.
3. Read the definition of population momentum. Using Charts 3.1 and 3.2 as a reference, in which economic groups and years do you think this phenomenon exists? Why?
4. Look at the shapes of the charts in Charts 3.1 and 3.2. What would a stabilized population look like? Explain.
5. What impact might population momentum have on the care of small children in a country where a large proportion of the childcare duties are performed by daycare centers? What about a population where elderly relatives provide childcare? Who are the caretakers of small children in your country? What effect might population momentum have on these arrangements?
6. What impact might an aging population have on the care of elderly people in a country where a large proportion of these people live in nursing homes or elderly housing? How are elderly people cared for in your country? What impact might an aging population have on this care?
7. Match each of the following descriptions with the country below that illustrates the trend described.

| [Back to Chart 3] | [ Top ] | [ Table of Contents ] |
Exploring the PGR Data Table
1. Read the definition of growth rates. Use the Data Table to find the countries that have negative average annual population growth rates projected for the years 1995–2010.
2. Make a copy of the blank Comparative Data Table and label the first column Countries and the second column Population growth rate, 1980–95. Then using the text and the Data Table, fill in the chart according to the following instructions.
3. Make a copy of the blank Comparative Data Table and label the first column Countries, the second column Population growth rate, 1980–95, the third column GNP per capita, 1995, the fourth column Access to safe water, 1989–95 and the fifth Access to sanitation, 1989–95. Then using the text and the Data Table, fill in the chart according to the following instructions.
| [Back to Data Table] | [ Top ] | [ Table of Contents ] |

Exploring PGR Photo 1
1. Look at the photograph. Describe what you see.
2. Would this be a common scene in your country? Why or why not?
3. In which country was this photograph taken?
4. Find the country in the world and regional map gallery. What region is it in?
5. Find the country in the Data Table and determine if it is a low-, middle-, or high-income economy. 6. According to the Data Table, what is this country's projected population growth rate for 1995-2010? Its 1995 GNP per capita? The percentage of its 1989-95 population with access to safe water? 7. What do you think life is like for the average person in this country? Support your answer. 8. What, if any, aspects of the activity shown in the photograph might help improve living standards in industrial countries? In developing countries? 9. Which sector of development (i.e., social, economic or environmental) is best represented by the photograph? Explain your answer. Is it possible for this photograph to represent other sectors as well? In what way? 10. In what ways might the activity in the photograph encourage sustainable development? In what ways might it discourage sustainable development? Explain your answer.| [Back to Photo 1] | [ Top ] | [ Table of Contents ] |

Exploring PGR Photo 2
1. Look at the photograph. Describe what you see.2. Would this be a common scene in your country? Why or why not?
3. In which country was this photograph taken? ]
4. Find the country in the world and regional map gallery. What region is it in?
5. Find the country in the Data Table and determine if it is a low-, middle-, or high-income economy. 6. According to the Data Table, what is this country's projected population growth rate for 1995-2010? Its 1995 GNP per capita? The percentage of its 1989-95 population with access to safe water? 7. What do you think life is like for the average person in this country? Support your answer. 8. What, if any, aspects of the activity shown in the photograph might help improve living standards in industrial countries? In developing countries? 9. Which sector of development (i.e., social, economic or environmental) is best represented by the photograph? Explain your answer. Is it possible for this photograph to represent other sectors as well? In what way? 10. In what ways might the activity in the photograph encourage sustainable development? In what ways might it discourage sustainable development? Explain your answer.| [Back to Photo 2] | [ Top ] | [ Table of Contents ] |
Exploring PGR Case Study 1
1. Who is the narrator of this case study and why is she holding this meeting?2. Who attends the meeting?
3. Why do some people say that the village can support more people? Why do other people say that the village cannot support more people?
4. How can spacing pregnancies help to produce a healthier, more economically secure family?
5. What are some of the benefits mentioned for having large families? What are some of the benefits to having small families?
6. In Christy’s opening presentation, she discusses “responsible parenthood” with the women. If you were to give a presentation on “responsible parenthood”, how would you define the term and what topics would you cover?
7. Christy tells the women that she works with the Ministry of Health. Why might the government want to slow population growth and encourage family planning?
8. Vivian tells the group that some of the men “were angry that outsiders were trying to meddle in our private affairs.” To what extent is having children a private matter, a public concern, or both? Use examples from the case study and your own experience to explain your answer.
9. At the end of the case study, Christy suggests that the group continue their meeting by talking about how to get more of the community, especially husbands, interested in family planning. What are some of the objections people might have to family planning? What are some of the reasons people might support family planning? If you were at this meeting, what strategies would you suggest to bring these two sides together?
11. Look at the Data Table and find Cameroon. What is the projected 1995–2010 average annual population growth rate? How does this compare with the projected 1995–2010 average annual growth rate for your country?
12. Is family planning an issue where you live? Explain.
| [Back to Case Study 1] | [ Top ] | [ Table of Contents ] |
1. Assume that you are the prime minister of a low-income country in which the population growth rate is 3 percent a year. Your government has adopted a policy of reducing the rate to 2 percent over the next 10 years. Listed below are some activities that could help your country reach that goal. Because of budgetary constraints, you cannot undertake all the activities at once.
2. This activity, which demonstrates how much family size can influence a country’s population, is designed to be done in class or with a group of people. If you are doing this activity by yourself, draw it out on a piece of paper.
3. Make a family tree by going back to your great-grandparents on both your
mother’s and father’s sides of the family. To whatever extent possible, list
the years in which people were born, were married, and died, as well as their
occupations and levels of education. If you do not know all of the information
yourself, interview other family members; older relatives are excellent sources.
After your family tree is assembled, analyze the data you collected and answer the
following questions to the best of your knowledge.
Note: Although one of the objectives of this exercise is to help you become
more informed about your own family, if you are unable to collect information
from your family, or if your family feels uncomfortable discussing this information,
you can interview a neighbor’s or friend’s family instead.
4. People’s decisions about family size affect not only themselves, but also the other people they share resources with. This exercise helps show how changes in population size over time can affect the demand on public services and natural resources. The more information and the more types of information you can collect, the more complete picture you can make, so it is best to do this exercise with a whole class. Because some information may be difficult to find, you may have to settle for estimates, but estimates can still show trends.
| [ Back to Research] | [ Top ] | [ Table of Contents ] |
| Copyright � 1998 IBRD/The World Bank |
[email protected] |