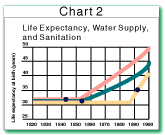
| a. |
What was the life expectancy in each city in 1820? What was the life expectancy in each city in 1900? What was the general trend for all three cities? |
|
|
|
Enter your answer in the space
below: |
Suggested answer: |
|
|
|
|
|
|
|
| b. |
About what year did each city begin its water supply and sanitation improvements? |
|
|
|
Enter your answer in the space
below: |
Suggested answer: |
|
|
|
|
|
|
|
| c. |
What does the chart suggest was the reason life expectancy was higher in Lyons in 1900 than in Paris or Marseilles? |
|
|
|
Enter your answer in the space
below: |
Suggested answer: |
|
|
|
|
|
|
|
| d. |
According to Chart 2, life expectancy in Marseilles began improving even before water and sanitation did. What are some possible explanations for this? |
|
|
|
Enter your answer in the space
below: |
Suggested answer: |
|
|
|
|
|
|
|
| 3. |
In the social sciences, researchers usually use current data to explore conditions and issues. Why would water supply, sanitation, and life expectancy information from 19th century France be helpful for people learning about these issues today? |
|
|
|
Enter your answer in the space
below: |
Suggested answer: |
|
|
|
|
|
|
|
5. You are a government official in a middle-income country. A crisis exists in your country because an epidemic of cholera
has broken out and is spreading rapidly. You are holding an emergency meeting with other officials to decide what to do. As you
plan your course of action, consider the following:
