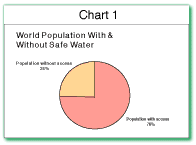
 Percentage of the World’s Population With and
Without Access to Safe Water, 1989–95
1. Study Chart 1, which shows world population and access to safe water and answer
the following questions.
- What percentage of the world’s population in 1989–95 did not have access to safe water?
- The total population of the world in 1995 was approximately 5.7 billion. Using your answer to question 1a, calculate how many
people were without safe water in the years 1989–95? (Divide the percentage by 100 to get a decimal, then multiply the total
population of the world by the decimal figure).
- How many people did have access to safe water?
2. In the year 2010, the population of the world is projected to reach 6.8 billion.
- If the number of people with access to safe water stays the same as it was in 1989–95, what percentage of the world’s
population in 2010 will have access to safe water? (Divide 4.33 billion by 6.8 billion and multiply by 100.)
- How does this percentage compare with that shown in Chart 1? Based on this information, would the
population in 2010 be better off, worse off, or the same? Explain.
3. Statistics can be powerful tools that help us understand our world. But statistics must be used carefully, and people must
understand what the data do and do not tell us.
It is the year 2000. You are running for reelection after two five-year terms as mayor of a city of 800,000 people. In 1990, the
population was 600,000, and at that time 37 percent of the population in the city had access to safe water. In the year 2000, 40
percent of the population in the city now have access to safe water.
- Did the percentage of population with access to safe water and sanitation increase or decrease during your time as mayor?
By how much?
- Calculate the number of people with access to safe water in 1990. Calculate the
number of people with access to safe water in 2000. Did the number of people with access
to safe water increase or decrease during your time as mayor. By how much?
- Did the number of people without access increase or decrease? (Find the percentage of the population without
access by subtracting the percentage of the population with access from 100%, convert the percentage into a decimal,
and then follow the calculations you used in question 2b.) By how much?
- As mayor, what can you say to voters about the progress you have made in the area of safe water and sanitation?
- What might your challenger say to voters about the lack of progress you have made?
- What can happen if statistics are not used carefully?
- What kinds of problems might make it difficult to provide safe water to people in urban areas where populations are growing
rapidly?
Answers
Home | Site Guide | Modules | What's SD? | SD Post | Resources | About DEP | Feedback

 Percentage of the World’s Population With and