 |
Remote Sensing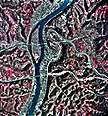 A high-level aerial photograph
can provide an overview of relatively large areas. The infrared aerial photo of downtown
Wheeling shows the Ohio River and lower Wheeling Creek as they appeared in 1991. Can you
see the coal barge moving up the river past the railroad bridge? That bridge is no longer
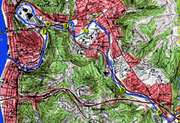
there. Compare a closer view of the six sites with the color photograph and topographic
map below. Left: High-level
aerial photograph over Wheeling, WV. Photo: Courtesy of Dr. Ben Stout A high-level aerial photograph
can provide an overview of relatively large areas. The infrared aerial photo of downtown
Wheeling shows the Ohio River and lower Wheeling Creek as they appeared in 1991. Can you
see the coal barge moving up the river past the railroad bridge? That bridge is no longer
there. Compare a closer view of the six sites with the color photograph and topographic
map below. Left: High-level
aerial photograph over Wheeling, WV. Photo: Courtesy of Dr. Ben Stout
Compare information provided by the three types of images. Which image is best? Do all contribute useful information? Consider these questions: What are some of the differences that occur at sites 2.6, 5.4, 6.2, 7.4, 10.6, and 12.0 km (1.6, 3.6, 3.9, 4.6, 6.6, 7.5, mi., respectively) upstream of the Ohio River. Compare the forest canopy, distance from the stream to nearby roads and buildings, and amount of "green space" around the streams in each photograph. How do these visual attributes compare with the biological community data presented in Scenario #1? [ Background Information ]
[ Site Description & Photos ] |
![]()
HTML code by Chris Kreger
Maintained by ETE Team
Last updated January 11, 1999