Lichens
Index
Archive
Resources
Global Lab
Classroom Activities
Transect Procedure

Lichen Transect Procedure
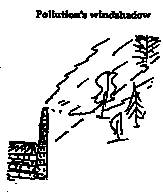
As a preliminary step, you might ask your local health officials, hospital personnel, or environmental agencies whether there are any known (or acknowledged) polluters in your area. Are there coal-fired plants in your area? They are often major sources of SO2. It would then be particularly relevant to plan your transect leading away from the "windshadow"; of this pollution. You would expect to see fewer, if any, thready lichens such as the fruticose, and, in general, fewer species altogether close to the polluting source.
Step 1: Lay out a transect across a 1 km walk. A local map with some detail will help you plan your walk, which ideally might stretch from a possible polluting source (e.g. coal-powered plant, factory) to a less polluting area. Estimate the direction of the prevailing wind. If there is no such apparent source of pollution, you can lay your transect out from rural to urban, from forest to a nearby highway.
Step 2: Divide the transect into 5 equally spaced sections, with 5 circular plots of about 5 meters diameter evenly spaced along the transect. These will be your sampling and studying areas. Assign a few students to each circular plot, so that the whole class is divided into teams of scientists.
Step 3: Select your tree species. So your results can be more easily compare with those of others, choose for your sampling substrate only one of the following (in order of desirability):
- Trees with alkaline bark, preferably ash, but if not ash, then elm or sycamore.
- Trees with acid bark, preferably oak, but if not oak, then beech or birch. If you do not know the pH of your trees, scrape some bark into water and measure with a pH strip test (or a probe if you have access to one.)
Step 4: At each site, band mature trees of your selected species (up to 10) at a height of 60 cm up the trunk and again at 120 cm by tying tape or string around the trunk. Mark the trees for later identification. You might want to practice banding trees nearer the classroom before starting out on your walk.
Step 5: For each tree
- Observe whether or not each of the three growth forms are present between the bands (Crustose, Foliose, or Fruticose) and record in Lichen Log.
- Count the number of different looking lichen forms present. (Number of different foliose, different crustose, different foliose). Enter in Lichen Log.
- Estimate the degree of cover, using the Degree of Cover sheet. Hold the chart up to the banded area and select the disk your lichen region most resembles. If over 50% cover, mark A for "all"; . Enter in Lichen Log.
Step 6: Record "samples" by drawing them. It is better not to damage a habitat by bringing many samples back to school, but rather to draw or photograph them just where you find them growing. Two "samples" of each kind of lichen from each sampling point should be enough. Mark carefully where you got them, the plot number and any distinguishing characteristics of the landscape, amount of sunlight, level of moisture. This will be your school record which will be continued by students in years to come.
The class artists could get involved in making a lichen poster, drawing the transect habitats and the lichens found in them.
Step 7: Make three graphs: Plot the distance along the transect from the polluting source on the horizontal axis against:
- The degree of cover (1-10)
- The presence of growth forms (0,1,2,3)
- The number of different growth forms of lichens
Step 8: Evaluate your data. Maybe you see a pattern. What could this mean? Is there any reason to believe a particular pollutant is dispersed in the region? How does it relate to any acid rain data you might locate? leaf yeast data?
Maybe there is no evident pattern. This doesn't mean that pollution is not having an effect in your region. The Irish studies contain this useful caution: "Don't worry if all your data sheets look similar, it's still valuable information."; With more data from other points in your region a picture may well emerge that was not visible with only one school's contribution. If you find out you need more data, perhaps you could involve other schools in your area in biomonitoring activities.
Back to Classroom Activities
Back to Lichens Index
Contact: Global Lab
� 1997 TERC. All rights reserved.